A few weeks ago I
wrote a post on “Generating DEMs from Contours” which was quite a
straight forward process as explained.In this post , I will show how
to “reverse engineer” the process and generate contours from
DEMs.
This time round
am also going to demonstrate how to clip our dataset to work with
the area of interest instead of working on the whole dataset.
Lets begin:
Assumption: You
have the DEM on your local machine.
If not so, data
can be downloaded from either USGS EarthExplorer or from
GeoComm
Steps:
Launch QGIS 2.X
and Load our Raster Layer (DEM) i.e. Ken_dem (sample data for this
tutorial)
 |
| DEM loaded in QGIS |
Go to Raster >
Extraction > Clipper (This will help us in clipping the area of
interest out of the entire Ken_dem dataset)
 |
| Launching clipper window |
I loaded the
“towns_layer” to know my area of interest and zoom to the
SELECTED town (Nakuru).This is the area I will be using as my area of
interest.
In the clipper
window, select the Output file location.On the Clipping mode check
the Extent mode.
 |
| Clipper window |
While still on
clipper window, switch to the main QGIS window –Click on one corner
of the canvas and hold on the left mouse button to drag to cover the
entire Map canvas(The selection will be highlighted in different
color as shown)
Get back to the Clipper window and check the x,y values.The values are autofilled after selection on canvas.
Get back to the Clipper window and check the x,y values.The values are autofilled after selection on canvas.
 |
| Selecting area on canvas |
Check the “Load
into canvas when finished” to add our results into QGIS.Click Ok to
clip.
The results are
loaded into QGIS.
Now we can
proceed on to generate contours.
Go to Raster >
Extraction > Contour
 |
| Opening Contour window |
On the contour
window, select the input file as the clipped file –clipper.Also
select the output file location. I will be generating contours with
50M interval so select 50.
Check on
“Attribute name” to auto generate the elevation column of the
output file.
Check on “Load
into canvas when finished” to display our results when
finished.Click OK to generate the contours.
 |
| Contour window |
After processing
is complete, load the towns layer to see our town of interest.
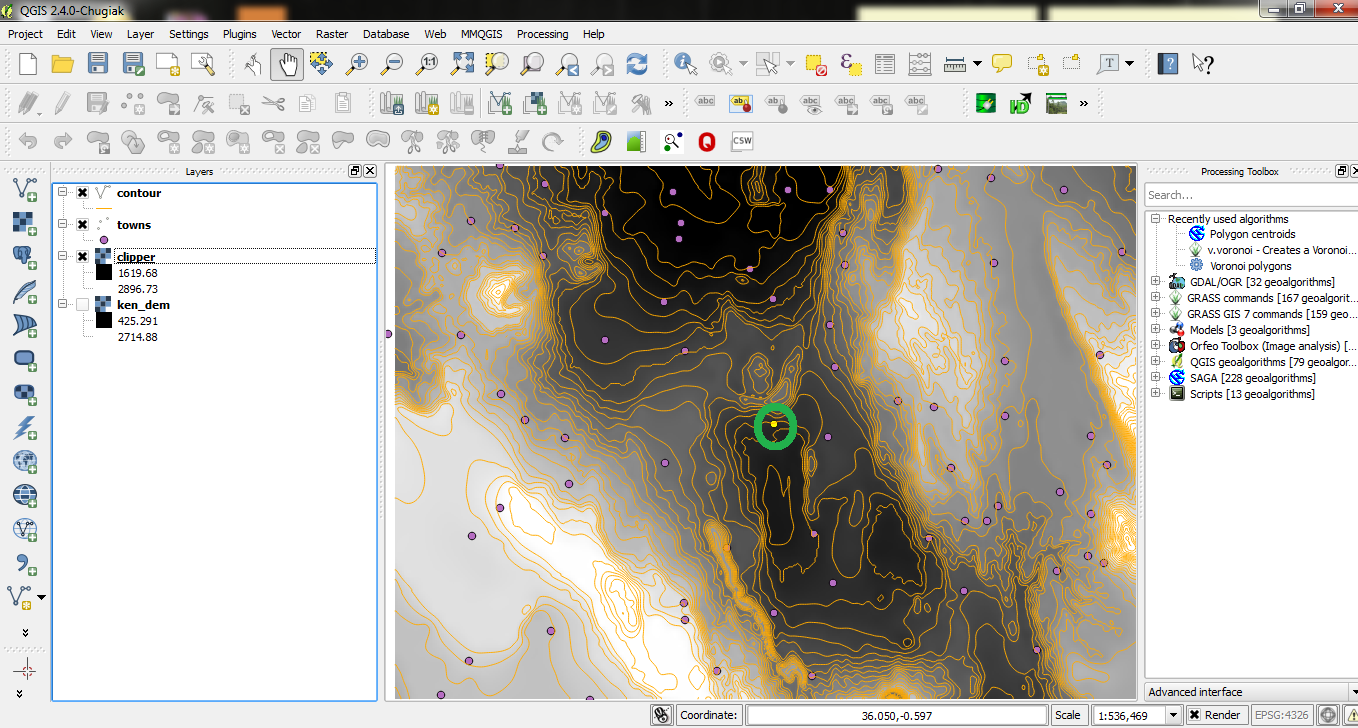 |
| Location of my town |
 |
| The Elevation column |
We can then go
ahead and introduce the “Color Ramp” in the contours layer to
categorize the layer.
I decided to use
the “MMQGIS” plugin available in QGIS to build the color ramp.
In Menu bar, go
to MMQGIS plugin > Modify > Color Ramp

In the color map
window choose the layer field to participate in the categorization
e.g. ELEV
Select the Ramp
Type - Quantiles
Select the
number of categories to be used (5).
Select the color
for different categories.
Select the Preset
and click OK
The results are
displayed and well illustrated

As usual, I would like to hear your views on this.Leave a comment.