Steps
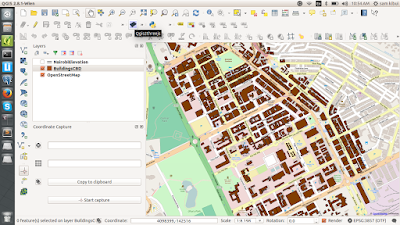
Load you data in QGIS canvas.In my case am using data for Nairobi buildings with a height attribute.
 |
| Buildings layer overlay |
Launch the Qgis2threejs plugin from the Web Menu.(Web > Qgis2threejs > Qgis2threejs) if you have Qgis2threejs intsalled.
If not go to Plugins Menu > Manage and Install Plugins and search for Qgis2threejs and install it.
 |
| Manage and Install Plugins window |
Launch the Qgis2threejs window to set parameters for the visualization.
 |
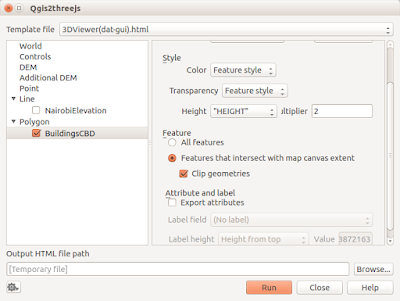
| Qgis2threejs window |
In this window click on polygon and check the BuildingsCBD layer.
On the "Object type" select Extruded .The layer will have some heights.
In the style section set the "Height" option to our HEIGHT attribute for the layer.
In the feature section leave it as default (Features that intersect with map canvas extent)
Browse to save the output file path and click Run.
The results will be automatically displayed on you default browser.
 |
| 3D visualization of the buildings data |
That's it.We are done.This is the very simple task to get our 3D view of our data....Mmmh Happy hacking
The data used can be found Here